The healthcare sector has had a rough run in 2025. Biotech stocks are also feeling the pressure. But investors looking to diversify or find underpriced segments may want to revisit the space. To get a clearer picture, we’ll look at two popular biotech ETFs — the iShares Biotechnology ETF (IBB) and SPDR Biotech ETF (XBI), writes Tony Dong, lead ETF analyst at ETF Central.
The following chart compares IBB and XBI using their respective price levels, 50-day simple moving averages (SMA), and 200-day SMAs. These moving averages are common technical indicators used to assess the direction of a trend. The 50-day SMA reflects the medium-term trend, while the 200-day SMA captures the longer-term picture.
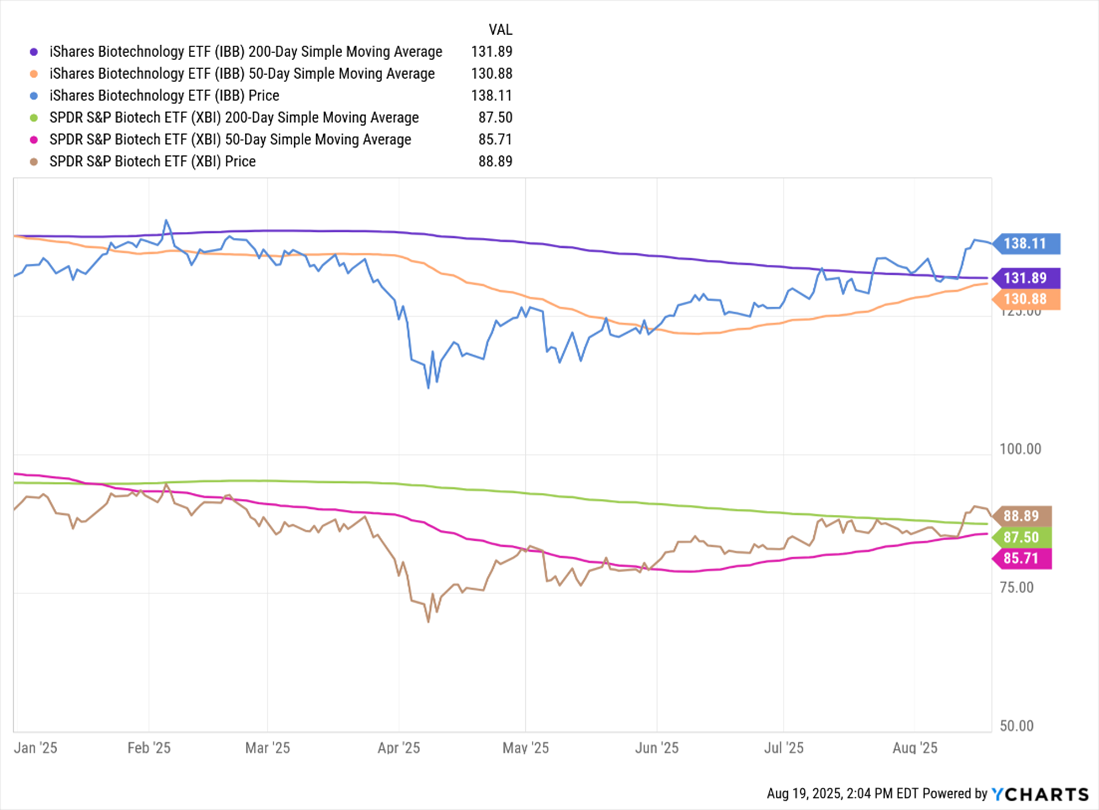
For IBB, the story looks relatively strong. As of Aug. 19, it was trading at $138.11, well above both its 50-day SMA ($130.88) and 200-day SMA ($131.89). More importantly, the 50-day recently crossed above the 200-day, a technical pattern known as a golden cross, which is typically viewed as a bullish signal. That tells us the medium-term trend has caught up with and overtaken the long-term trend, and it often confirms a shift into an uptrend.
XBI, on the other hand, is showing some recovery but hasn’t confirmed the same trend reversal. It was recently trading at $88.89, just slightly above both its 50-day ($85.71) and 200-day ($87.50) SMAs. Unlike IBB, the 50-day is still below the 200-day, so no golden cross yet. The narrowing gap between the two does suggest momentum is improving, but the trend remains unconfirmed.
For me, this technical setup suggests that larger-cap, commercialized biotech names, which dominate IBB due to its market-cap weighting, are leading the rebound. Smaller and mid-cap clinical-stage biotechs, which make up a greater share of XBI’s equal-weight strategy, continue to lag.
Throughout 2025, both ETFs showed periods of weak momentum (March and April stand out), with RSI levels dipping close to or below 30. Since then, the RSI trend for both has been steadily climbing, and recent price moves have pushed RSI near the higher end of the neutral range.
Given how close both ETFs are to the overbought threshold, much of the easy money may already be in. This doesn’t necessarily mean a pullback is imminent, but it does mean any fresh entries at this point may face short-term resistance.
See more articles from Tony here…
Read full article here »
IBB and XBI- Are These Biotech ETFs Worth Trading Here
The healthcare sector has had a rough run in 2025. Biotech stocks are also feeling the pressure. But investors looking to diversify or find underpriced segments may want to revisit the space. To get a clearer picture, we’ll look at two popular biotech ETFs — the iShares Biotechnology ETF (IBB) and SPDR Biotech ETF (XBI), writes Tony Dong, lead ETF analyst at ETF Central.
The following chart compares IBB and XBI using their respective price levels, 50-day simple moving averages (SMA), and 200-day SMAs. These moving averages are common technical indicators used to assess the direction of a trend. The 50-day SMA reflects the medium-term trend, while the 200-day SMA captures the longer-term picture.
For IBB, the story looks relatively strong. As of Aug. 19, it was trading at $138.11, well above both its 50-day SMA ($130.88) and 200-day SMA ($131.89). More importantly, the 50-day recently crossed above the 200-day, a technical pattern known as a golden cross, which is typically viewed as a bullish signal. That tells us the medium-term trend has caught up with and overtaken the long-term trend, and it often confirms a shift into an uptrend.
XBI, on the other hand, is showing some recovery but hasn’t confirmed the same trend reversal. It was recently trading at $88.89, just slightly above both its 50-day ($85.71) and 200-day ($87.50) SMAs. Unlike IBB, the 50-day is still below the 200-day, so no golden cross yet. The narrowing gap between the two does suggest momentum is improving, but the trend remains unconfirmed.
For me, this technical setup suggests that larger-cap, commercialized biotech names, which dominate IBB due to its market-cap weighting, are leading the rebound. Smaller and mid-cap clinical-stage biotechs, which make up a greater share of XBI’s equal-weight strategy, continue to lag.
Throughout 2025, both ETFs showed periods of weak momentum (March and April stand out), with RSI levels dipping close to or below 30. Since then, the RSI trend for both has been steadily climbing, and recent price moves have pushed RSI near the higher end of the neutral range.
Given how close both ETFs are to the overbought threshold, much of the easy money may already be in. This doesn’t necessarily mean a pullback is imminent, but it does mean any fresh entries at this point may face short-term resistance.
See more articles from Tony here…
Read full article here »